Difference between revisions of "Q4"
From Viz Matters
Tim Morris (Talk | contribs) |
Tim Morris (Talk | contribs) m |
||
| (One intermediate revision by the same user not shown) | |||
| Line 1: | Line 1: | ||
===What visualisation techniques are important to your work?=== | ===What visualisation techniques are important to your work?=== | ||
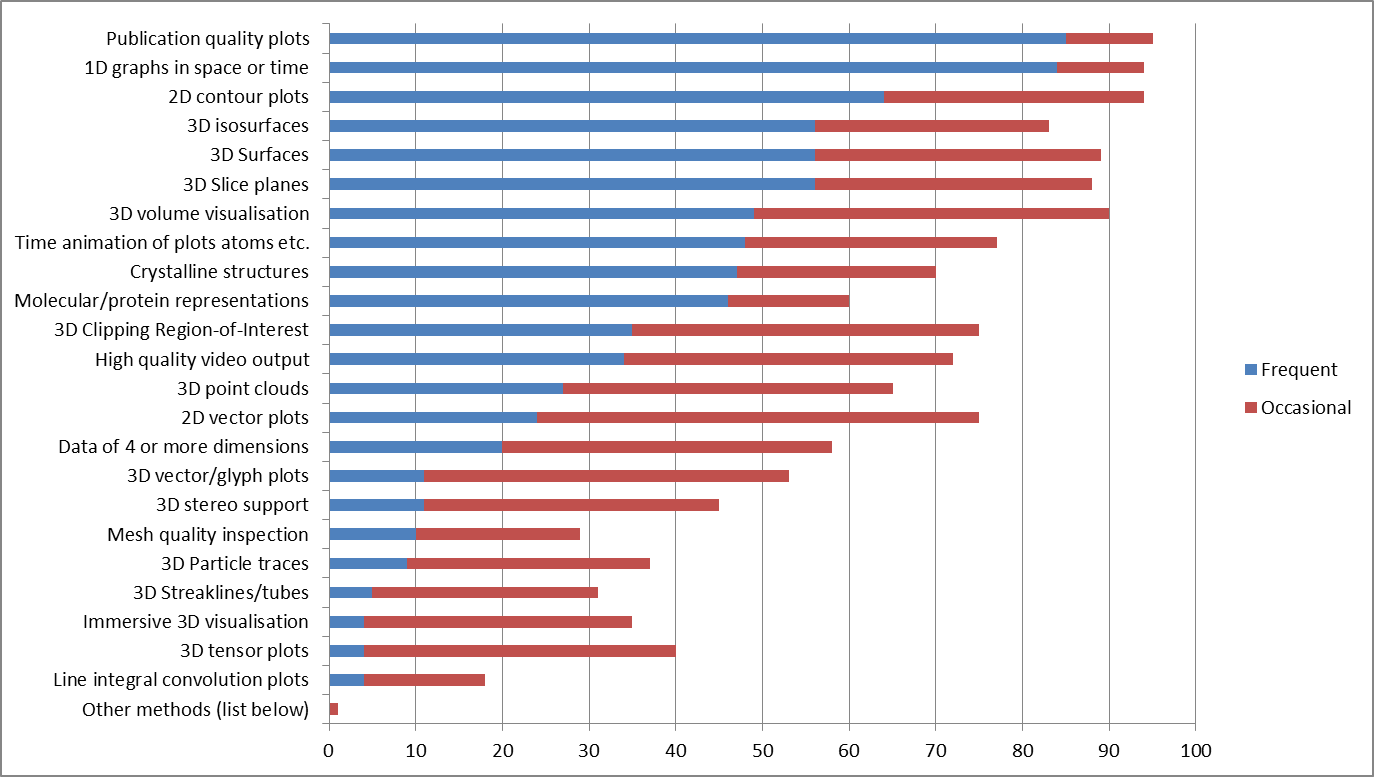
| − | + | We provided a list of what we believed to be the important techniques used by members of the CCPs. The question asked about how often these were used. Answers were one of: not needed, may be useful or frequently used. The histogram represents the results ordered by the summation of the positive replies. | |
| Line 8: | Line 8: | ||
====Observations==== | ====Observations==== | ||
| + | *Looking at the frequently used techniques: | ||
#The most frequently used visualisation technique is to produce publication quality output. | #The most frequently used visualisation technique is to produce publication quality output. | ||
#The facility to produce line graphs is equally important | #The facility to produce line graphs is equally important | ||
| + | *Looking at the combined "frequently used" and "may be useful" techniques | ||
| + | #There is a less clear distinction between the top techniques: | ||
| + | #Publication quality output is the most used | ||
| + | #Simplified visualisation methods are also required | ||
Latest revision as of 12:19, 30 January 2015
What visualisation techniques are important to your work?
We provided a list of what we believed to be the important techniques used by members of the CCPs. The question asked about how often these were used. Answers were one of: not needed, may be useful or frequently used. The histogram represents the results ordered by the summation of the positive replies.
Observations
- Looking at the frequently used techniques:
- The most frequently used visualisation technique is to produce publication quality output.
- The facility to produce line graphs is equally important
- Looking at the combined "frequently used" and "may be useful" techniques
- There is a less clear distinction between the top techniques:
- Publication quality output is the most used
- Simplified visualisation methods are also required
